Emacs Orgmode and Gnuplot
I use the emacs editor for nearly everything, including taking notes where I use org-mode. To produce nicely formatted documents, I export to LaTeX and generate PDFs. I recently wanted to include a bar chart in a document and discovered that, yes, org-mode supports that!
I enabled org-babel support in my init.el:
(org-babel-do-load-languages
 'org-babel-load-languages
 '((gnuplot . t)))
In the document I have a section containing the data in an org table.
The #+tblname property sets the name used below in the plot. The tag
:noexport: prevents the section, and therefore the table, from being
rendered:
** DATA TABLE :noexport:
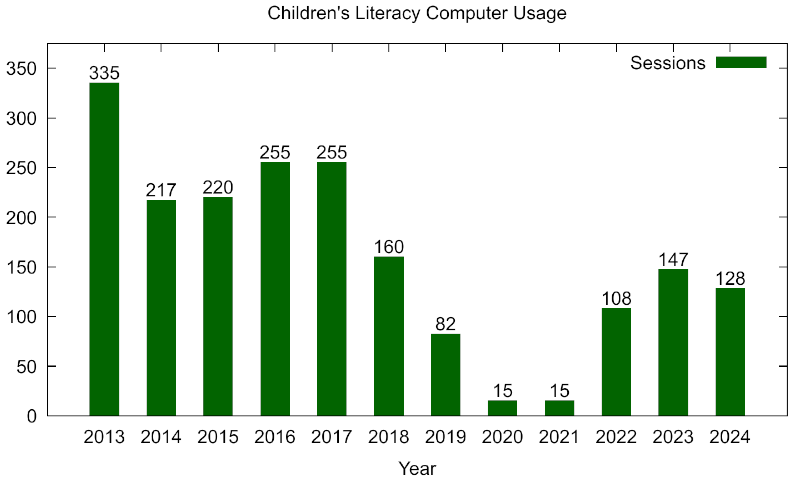
#+tblname: usage
| Year | Sessions |
|------+----------|
| 2013 | 335 |
| 2014 | 217 |
| 2015 | 220 |
| 2016 | 255 |
| 2017 | 255 |
| 2018 | 160 |
| 2019 | 82 |
| 2020 | 15 |
| 2021 | 15 |
| 2022 | 108 |
| 2023 | 147 |
| 2024 | 128 |I have the following literal which defines the plot, it’s straight
forward gnuplot. The enclosing #+begin_src and #+end_src have
metadata indicating the name of the table, defined above, from which
to source the data and where to send the resulting plot.
#+begin_src gnuplot :var data=usage :results output :file ./usage.pdf
  set title "Children's Literacy Computer Usage"
  set xlabel "Year"
  set yrange[0:375]
  set ind:1
  set style data histogram
  set style histogram cluster gap 1
  set style fill solid
  set terminal pdf
  set boxwidth 2
  plot data using 2:xtic(1) title "Sessions" lt rgb "dark-green", "" using 0:($2+.1):(sprintf("%d",$2)) with labels offset 0,0.5 notitle
#+end_src
Then I insert the results where desired:
#+RESULTS: [[file:./usage.pdf]]When export is run emacs prompts to generate the plot, which ends up looking like this: